Venn Diagrams
Venn diagrams are a visual tool that represents sets and their relationships using circles. They help easily understand union, intersection, difference, and complement.
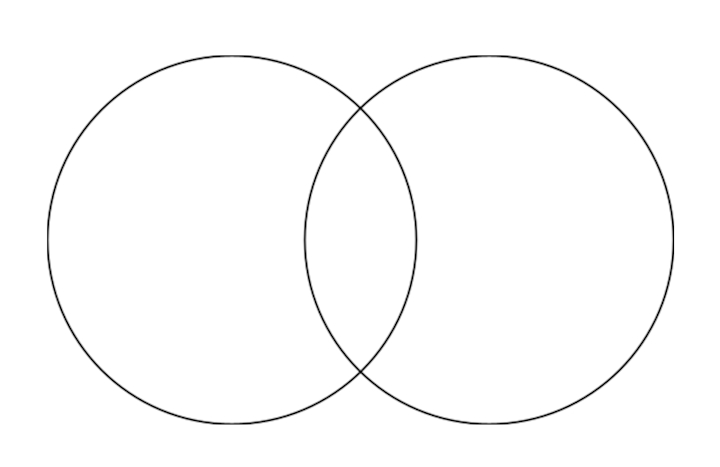
Venn diagram of two sets: the overlapping area is the intersection (A ∩ B).
Representation of Two Sets
- Union (A ∪ B): all elements in both circles.
- Intersection (A ∩ B): the overlapping area of the two circles.
- Difference (A − B): the part of one circle that does not overlap with the other.
- Complement (A'): the part of the universal set not in A.
Representation of Three Sets
For three sets, we draw three overlapping circles. The central area where all three circles overlap represents the elements common to all three sets.
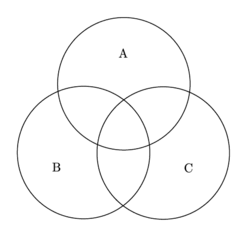
Venn diagram of three sets: the central area contains elements common to all three.
Practice Exercise
We have reviewed and checked the materials, but errors may still occur. The content is provided for educational purposes only, so use it at your own responsibility and verify with other sources if needed.
✨ Ask Lara — your AI study partner
Unlock personalized learning support. Lara can explain lessons, summarize topics, and answer your study questions — available from the Go plan and above.
Lara helps you learn faster — exclusive to ReadyTools Go, Plus, and Max members.