May 16, 2026
ReadyTools Official Updates Page Is Now Live – Fresh Announcements, Raw Improvements & Everything You Need to Know
We’ve just launched something we believe you’re going to love: the new ReadyTools Official Updates Page.
Read article
Blog article
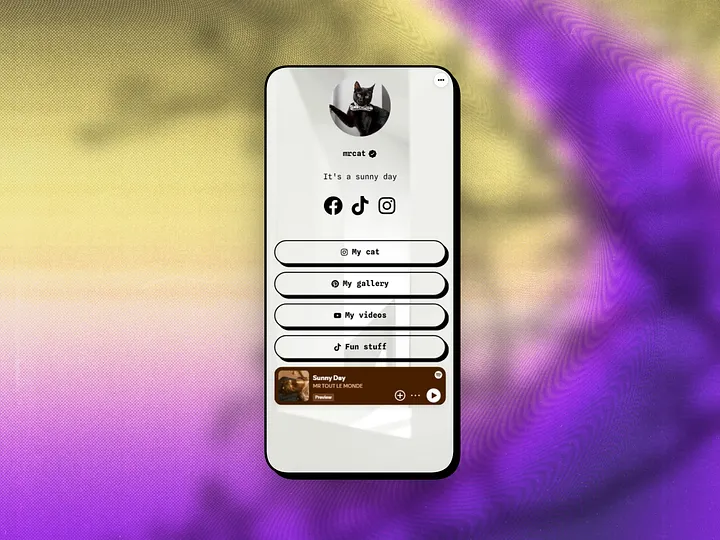
If you’ve been building your online presence with Linksy, you already know how powerful a single, beautiful link-in-bio page can be. It turns scattered soc
readytools
May 6, 2026
5 min read
Share
If you’ve been building your online presence with Linksy, you already know how powerful a single, beautiful link-in-bio page can be. It turns scattered social bios, email signatures, and content links into one clean, professional hub that actually converts.
But here’s the truth most creators and businesses eventually face: views alone don’t tell the full story. You can have hundreds of visitors and still wonder:
That’s exactly why we’ve rolled out a major analytics upgrade across ReadyTools Linksy. These aren’t just prettier charts. They’re practical, actionable insights designed to help you post at the right time, understand real audience behavior, and optimize your page with confidence.
Let’s walk through what’s new — and why it matters.
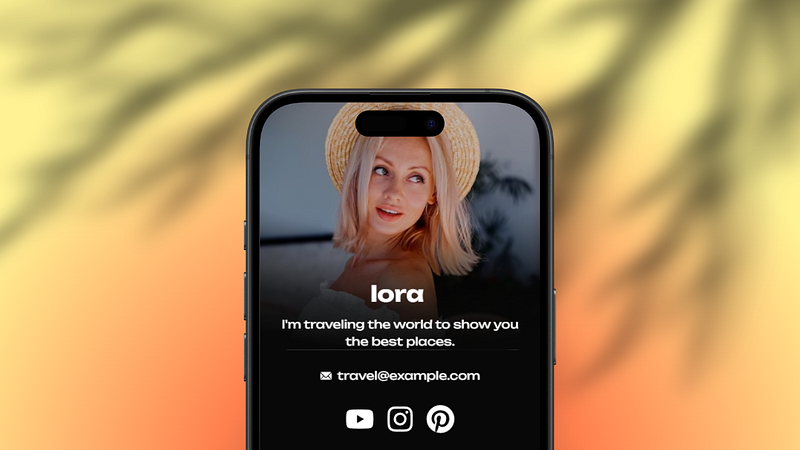
 ReadyTools Linksy Image showcase with profile lora
One of the most exciting additions is the Best Time to Post card. Instead of generic “best times for Instagram” advice that doesn’t apply to your audience, Linksy now analyzes your own visitor patterns and tells you exactly when your page gets the most attention.
You’ll see:
Why this changes everything: If most of your engaged visitors are active between 9 and 11 AM, that’s when you should be dropping new content, Stories, or emails that drive traffic to your Linksy page. Post during your actual peak window and you’ll see higher click-through rates without increasing your posting volume. It’s like having a personal audience researcher working 24/7.
 ReadyTools Linksy Image showcase with profile lora
Total clicks can be misleading. Ten clicks from one highly interested person look the same as ten clicks from ten different people — until now.
The new Click Quality section gives you a clear breakdown:
This is gold for understanding loyalty. A high “clicked again” percentage tells you your content or offers are sticky — people are coming back because they found value. A mostly one-time pattern? It might be time to refresh your top links, improve your page structure, or add stronger calls-to-action.
You get these insights in a privacy-safe, aggregated way so you can focus on what matters: building a real relationship with your audience.
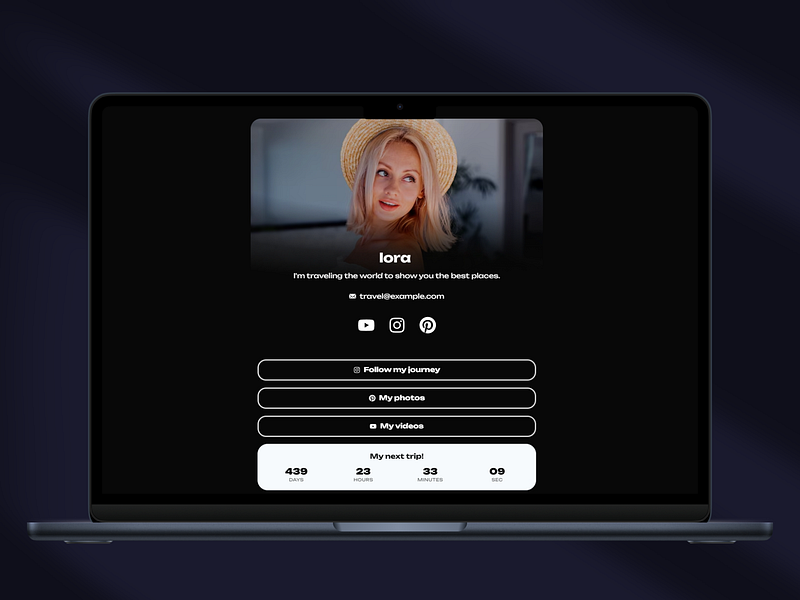 ReadyTools Linksy Image showcase with profile lora on computer
Here’s a question every page owner asks: “Are people actually seeing my most important links, or are they leaving after the first few?”
The new Scroll Depth analytics answers this directly. You’ll see:
Real-world impact: If 100% of visitors reach the middle but only 33% make it to the bottom, you know your strongest offers should live higher up. Or perhaps you need more compelling section headers or visuals to encourage deeper scrolling. This single feature can dramatically improve conversion rates by helping you place the right content in the right places.
You don’t always want to switch tabs to check performance. That’s why we’ve added smart, at-a-glance insights directly on the main General page (the screen where you add and organize links).
Now you can see:
This creates a much faster feedback loop. Spot a winning link? Promote it more aggressively. See a link underperforming? Investigate and improve it — all without leaving your main workspace.
Your Linksy page often serves as a social directory too. Now you can finally see which social icons visitors are actually clicking.
Whether it’s Instagram, TikTok, X, YouTube, or any other platform you’ve added, you’ll know exactly which ones are resonating. This helps you:
For users who want to go further, the Deep Analytics tab includes additional powerful views:
Everything is designed to be intuitive and actionable — whether you’re a creator checking performance once a week or a brand optimizing campaigns daily.
Most link-in-bio tools give you basic view and click counts. ReadyTools Linksy now gives you context — the “when,” “how deeply,” and “which parts” that turn raw numbers into real strategy.
These features help you:
Whether you’re a content creator, coach, small business owner, or influencer, the goal is the same: turn more visitors into meaningful actions. These new analytics bring you significantly closer to that goal.
The updated analytics are available now in your Linksy dashboard. Basic insights are accessible to all users, while some of the deeper historical views and advanced breakdowns are part of our Premium plans.
Log in, head to the Analytics tab, and explore. We think you’re going to love what you discover.
Have feedback or ideas for the next set of insights? We’re always listening — your suggestions directly shape what we build.
ReadyTools Linksy — Beautiful links. Smarter decisions. Real growth.
Welcome to the next level of understanding your audience.
Discover ReadyTools: the ultimate productivity suite for creators. Beautiful Linksy pages, smart Lara AI, project management, secure cloud storage, and everything else you need — all together. Start your 7-day free trial today.
Explore ReadyToolsTable of Contents
Keep reading
May 16, 2026
We’ve just launched something we believe you’re going to love: the new ReadyTools Official Updates Page.
Read article
May 8, 2026
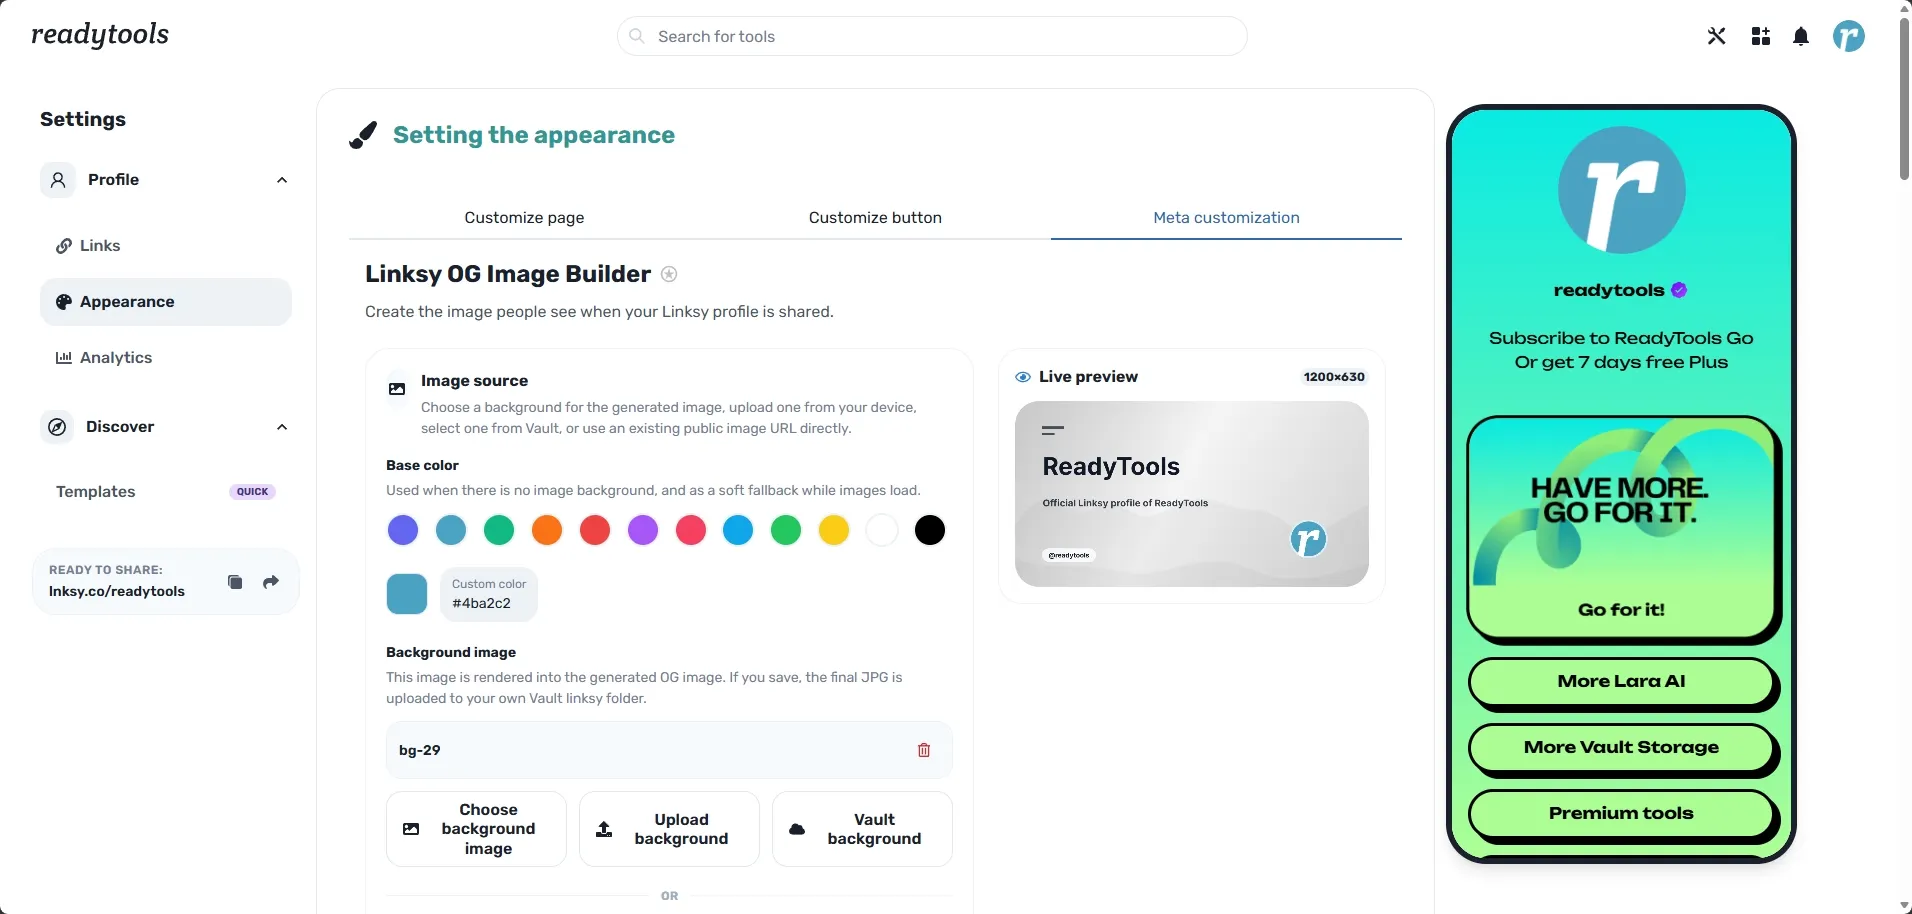
When someone shares your Linksy page on Twitter, LinkedIn, Discord, or in a newsletter, the first thing people see is your OG image — the 1200×630 preview
Read article
May 7, 2026
If you’ve been using ReadyTools Linksy to build your link-in-bio page, you already know the power of full design freedom on the free plan — custom buttons,
Read article